In this post, I present some data and analysis that I have published in my Drafting Textbook published at Amazon.com. (from Chapter 6)
By Dr. John Bush
(www.fantasysportsprofessors.fantasysportsprofessors.com)
I analyzed the relationship of the QB, RB and WR players ranked by their Pre-Season ADP (PS-ADP) and their End-of-Season long PPR points scored (ES PPR) to determine how strong the finish was for each position (PS-ADP vs. the ES-PPR). The data of the PS-ADP vs. ES-PPR from the years of 2012 to 2014 is presented in the next figure.
Figure 1. Percentage of the QB, RB and WR Top 12 PS-ADP who also had a top 12 finish in their ES-PPR from 2012 to 2014.
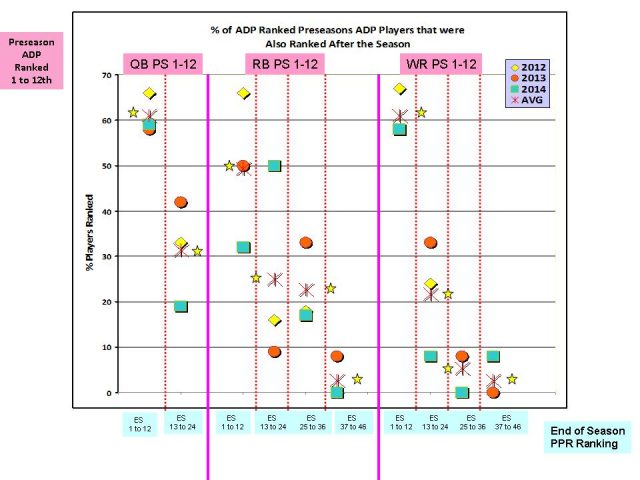

Figure 1 present the PS-ADP vs. ES-PPR data for three Positions, QB, RB and WR. Once again using data from years 2012, 2013 and 2014, the percentage of PS-ADP players out of the top 12 players in each position and their end of ES-PPR season finish points were plotted. The Bold Pink lines separate the three positions while the Dashed Red Lines separates the finishing groups. (1st to 12th ES-PPR = 1st finish group, 13th to 24th ES-PPR = 2nd finish group, 25 to 36th ES-PPR = 3rd finish group and 37 to 48th ES-PPR place = 4th finish group). The Red Hex Crosses (X) are the actual ES-PPR player year averages for each Pre-Season ADP Defined Position and the ES Finish . The yellow stars represent the average of the ES-PPR of all of the three years examined in each grouping.
Let you eye flow from star to star to visual the averages.
As seen in figure 1, the analysis of the top 12 PS-ADP ranked QBs showed that only 60% of them finished in the top 12 of ES-PPR ranked QBs. Interestingly, only 30% of the top PS-ADP QBs finished between the 13 to 24th rated ES-PPR QBs. The final 10% of the PS-ADP QB’s were ranked worse than the 24th ranked ES-PPR QBs.


Analysis of the top 12 PS-ADP ranked RBs showed how they finished within 4 different groups of ES-PPR ranked RBs. Significantly, only about 50% of the top 12 PS-ADP finished as the top 12 ES-PPR RBs. Furthermore, 27% of those same PS-ADP ranked RB players finished between 13th and 24th ES-PPR RB while 20% of the top 12 ES-PPR RB finished in the top 25 to 36th ES-PPR RBs and about only 3% PS-ADP RB finished within the 36th to 48th ES-PPR RBs.
In the analysis of top 12 PS-ADP WR players, only 62% of them finished in the top 12 ES-PPR ranked WRs. This number was closer to the QBs and higher than that of the RB position. Importantly, there is less year-to-year variation within the 2012 to 2014 ES-PPR WR data as demonstrated by the tight grouping of the three-year data. Therefore, the top PS-ADP WRs are who you think they are! Only 20% of the top 12 PS-ADP ranked WRs finished in the next flight of ES-PPR WR (13th to 24th finish) and the final 10% of the top PS-ADP WRs finished within the next 2 groups of ES-PPR WRs (24 to 48th).
So find a current ADP list of WR on average only 60% ish will be in the top finishing WR. So 40% will be surprises from outside the top 12 PS-PPR WRs. Thus, we can expect a failure of 4 to 5 WR of the current top 12 ADP. Who are they? I would look at each one and ask the future question ” At the end of the season this WR failure, he failed because ___. List the reasons why they could have failed!. A.J. Green was a bust because his QB got hurt. A.J. Green failed because he got hurt. AJ Green failed because the running game was working so well WR activity was not needed as much. I would list all reasonable idea and assign a chance to each. Do that for all current 12 WR and see what shakes out.
Hey Dr. Bush I do not have time to invest in all that work. I want the fire first and then I will chop the wood!
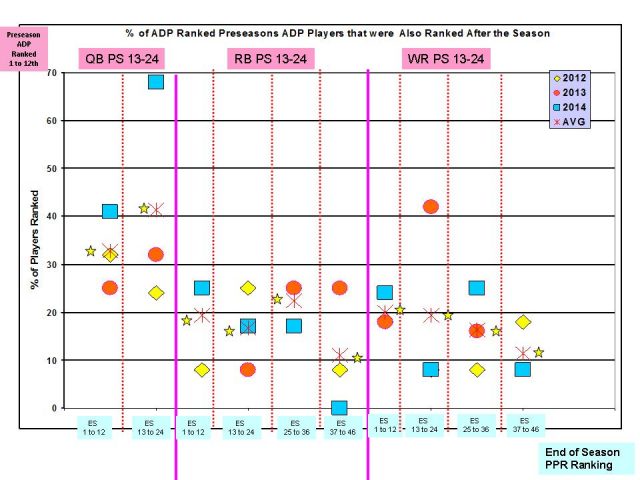
Figure 2 presents the data looking at the 13th to 24th PS-ADP players. A quick takeaway is that the QB position is the one where just using PS-ADPs you can catch a star while it is much harder in both the RB or WR PS-ADP players. In the QB position, 32% of 13th to 24th PS-ADP ranked QBs finished in the top 12 ES-PPR QB group while this result was only 18 to 19% in both the ES-PPR ranked RBs and WRs. Hence, the late round QB drafting success! You can wait into the draft after the last QB1 and still have a 30% chance of having a QB1 on your hands.
Love our content? Check out the GoingFor2 Live Podcast Network!
Figure 2. The percentage of the 13 to 24th PS-ADP players who finish in each of the ES-PPR groups from 2012 to 14.
I followed up on theses observations and conclusions from the 2012 to 2014 PS-ADP/ ES-PPR data and will present updated data from the 2015 season, Figure 3 presents the 2015 top 12 PS-ADP ranked QBs plotted against their ES-PPR finish. It had been established that about 60% of the top 12 PS-ADP QBs were expected to finish in the top 12 ES-PPR. In 2015, Figure 24’s graph shows that number was 8/12 or 66% of the PS-ADP QB finished in the top ES-PPR level. This conclusion adds to the narrative concerning the 60% success rate for top 12 PS-ADP QBs being a QB1 type.
Figure 3. Plot of the 2015 top 12 PS-ADP QBs finishes in the top ES-PPR levels
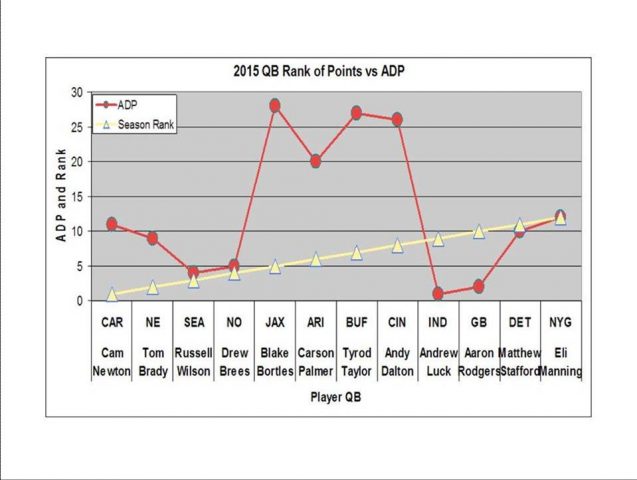
Figure 4 illustrated plotted data from the 2015 top 12 PS-ADP RBs vs. their ES-PPR finishing rankings. Analysis of the graph shows that in 2015, in the top 12 PS-ADP RBs, only 50% of them finished in the top 12 ES-PPR rankings. This number was similar to 2012-2014 data. Therefore, RBs will be the riskiest choice you will make in a draft. I suggest you keep records as it is critical to judge how well or not you are at drafting solid RBs.
Figure 4. Plot of the 2015 top 12 PS-ADP RBs finish in the top ES-PPR levels
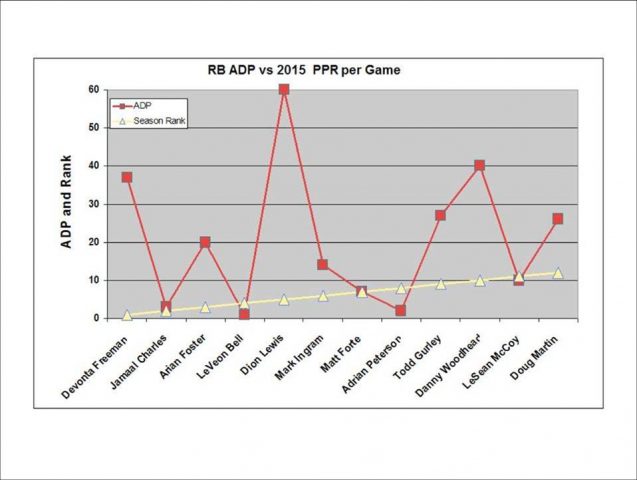
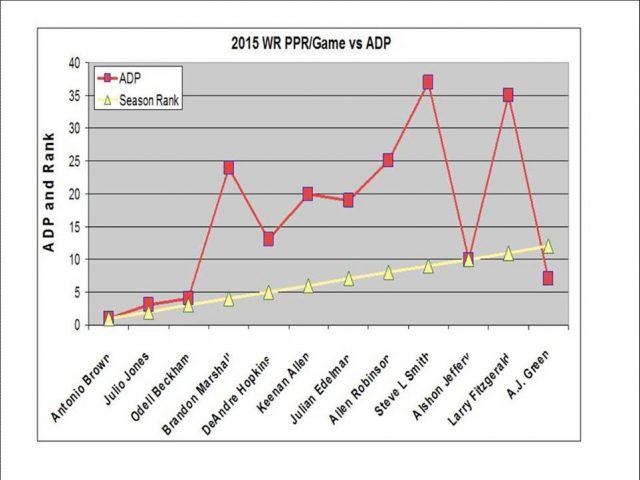
Figure 5 presents the plot of the 2015 top PS-ADP ranked WRs and only 41% finished in the top ES-PPR finishing levels. This number is much lower than the 2012-2014 WR aggregate averages of 60%. Therefore, 2015 was a bad year for top 12 PS-ADP WRs, which seems to fly in the face of the conventional wisdom that WRs are safer than RBs in drafting. Be thoughtful about your 2016 drafting of WRs.
Figure 5. Plot of the 2015 top 12 PS-ADP WRs finish in the top ES-PPR levels
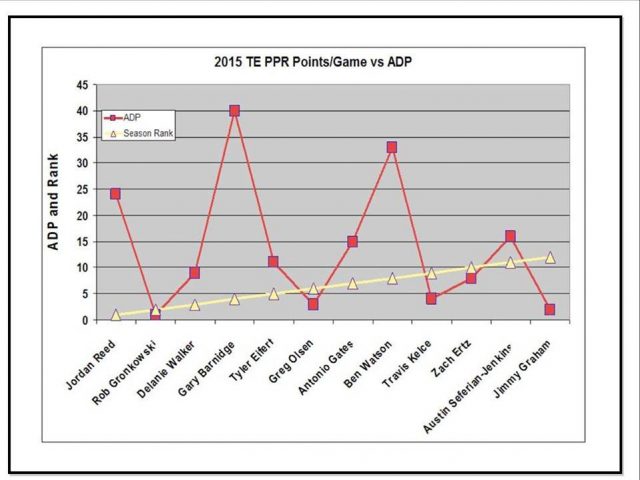
In figure 6, the fate of the top 12 PS-ADP TEs from 2015 is plotted. Analysis of the data shows that about 60% of the PS-ADP TEs finished in the top ES-PPR group. This number is similar to the QB position but higher than either the PS-ADP RBs or WRs from 2015.
Figure 6. Plot of the 2015 top 12 PS-ADP TEs finish in the top ES-PPR levels
Conclusions
1) ADP is not the complete story and is not as solid as you think on average especially for RBs and maybe WRs. Consider hypothetical questioning of the top players and try to list all reasons with probabilities as to why they could fail this season.
2) QBs and TEs are the least risky and I suggest a strong consideration be given to go late on both positions. (Not in a 2QB league)
3) WRs have been consistent but last year’s data should give you pause.
4) RBs continue to be the risky position that can be landmines to your drafted team. I discuss in my textbook, a stress testing concept that might help you after the draft.
5) Using your records, the direction for your draft always comes down to what you have been successful with in the past.
“You are who they think you are”.
My Vision Statement
Winning consistently at Fantasy Football is difficult. In some respects, it’s one of the most difficult of all endeavors. To succeed takes enormous conviction and commitment. Most individuals don’t succeed because they lack self-awareness and the ability to modify their actions to play to their strengths and minimize their weaknesses. In gambling/trading/fantasy sports, the only asset you have is yourself, the self-developed habits or traits that support the very structure you depend on. In gambling/trading/fantasy sports, you set the guidelines and make the rules of how you approach these activities. In effect, you become God. When you’re God, it’s easy to change the rules. You simply say, “the rules don’t really apply to me.”
Juel Anderson notes, “at any given time the behavior of the 90 percent is working to create an advantage for the 10 percent. (Modified from Quotes from Personality Traits of Traders and Gamblers by Price Headley and Trading, Sex & Dying”, by Juel Anderson).
In other words, it’s easy to avoid the self-discipline you need to win at fantasy football. Your mind will play tricks on you if you don’t have a systematic process for drafting and playing. Only a few win at fantasy football. In your season-long leagues, there are those who are always playing in the toilet bowl and others always in the playoffs.
My posts here are at Going for 2.com as well my personal blog (www.fantasysportsprofessors.fantasysportsprofessors.com) and textbooks are meant to help you move forward and stay within the winning 10%.
Using data from the past and present seasons, I will present in each post, a partial piece of the needed road-map to allow you, my readers, to be in the winning group by training/challenging/pointing the way for you to effectively analyze data and develop approaches that work in the context of fantasy football. Good Luck this season!.
[wysija_form id=”1″]
ATTN Dynasty Commissioners: Do you want to do something cool for your league? How about a 1-hour live show dedicated to YOUR league? Team-by-team breakdowns, rankings, and more. For details and to book a show, visit: GoingFor2.com/plp.