A Treatise on Best Ball: Improving On the Clock Decisions
First of all, a shout-out to all of the sickos that enjoy fast drafts. There are just too many things I’m thinking about to make an optimal decision in 30 seconds. And that’s really the basis of this article. The goal is to walk through all of the things I’m thinking about when on the clock. And to do that, we’re going to use Underdog’s Best Ball Mania data from last year to uncover what optimizes our chances of making the playoffs and Week 17.
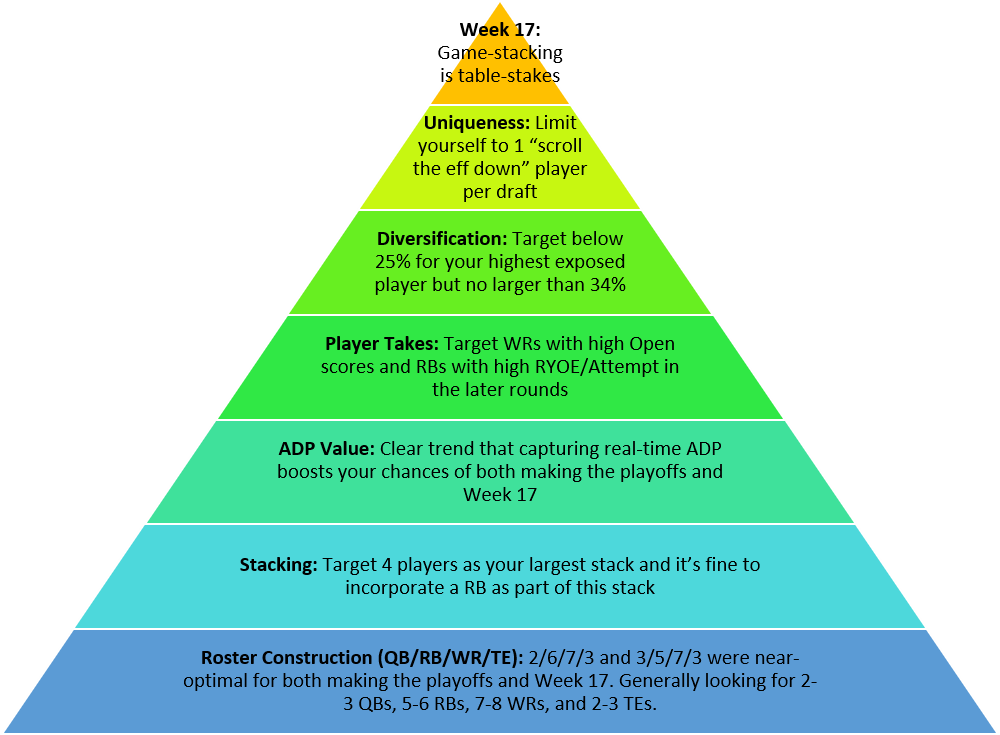
Let’s start with a summary image below and then I’ll dig much further into each topic. Shout-out to Justin Herzig of Establish the Run whose pyramid I’m relying on heavily. You can check out his original version here.

Roster Construction
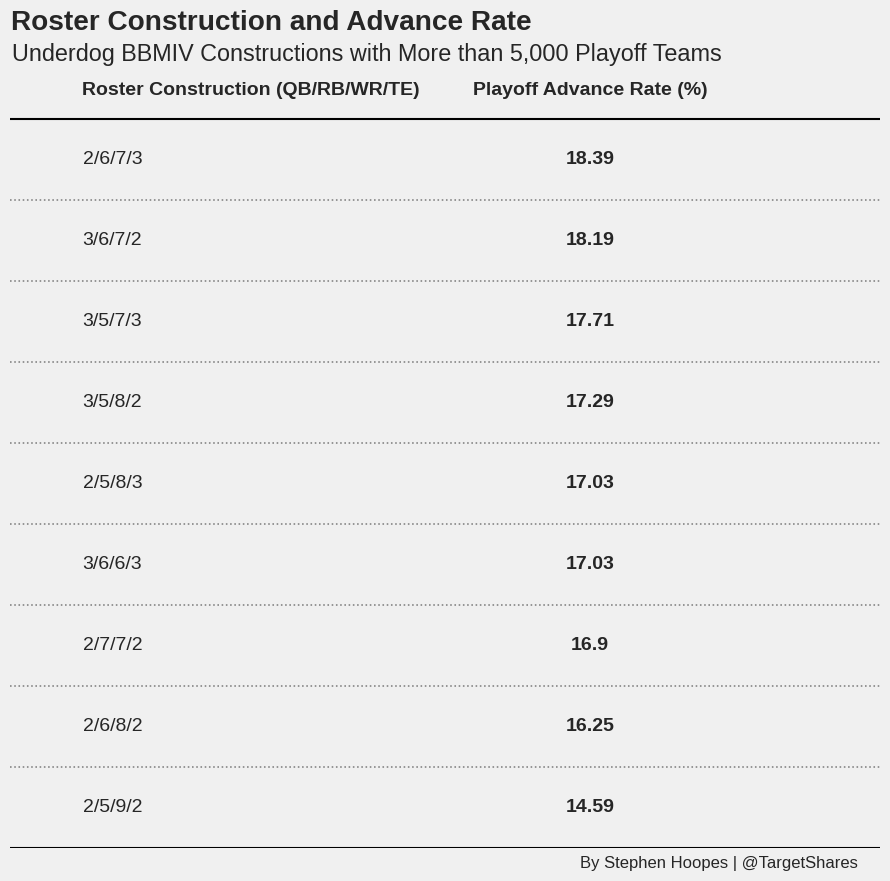
By roster construction, I simply mean the number of QBs, RBs, WRs, and TEs that you’ll draft with your 18 picks. The table below shows the nine most popular roster constructions used in BBMIV. If the game was purely random, you would make the playoffs 2/12 or about 16.7% of the time. With that in mind, the goal is to look for ways to increase our playoff odds above that 16.7% benchmark.
The top five roster constructions listed below all have playoff advance rates above 16.7%. Moreover, despite there being 38 unique roster constructions in the BBMIV finals, 60% of the teams had one of these five roster constructions. A word of caution is that 3 QB builds may have been particularly successful last year due to the large number of QB injuries. And if that doesn’t occur again this year, we might see 2 QB constructions find even more success. But when in doubt, I’m going to lean toward one of the top five roster constructions listed below.
Stacking
The goal of stacking is to reduce the number of things that you need to go in your favor. For example, if you draft Ja’Marr Chase in round 1, then you’re making a bet that Chase will have a massive season. If that’s the case, Joe Burrow is probably going to outperform his average draft position (ADP) as well. At this point, stacking has fully infiltrated the best ball landscape. Among the BBMIV finalists, every single team had at least two players on the same NFL team.
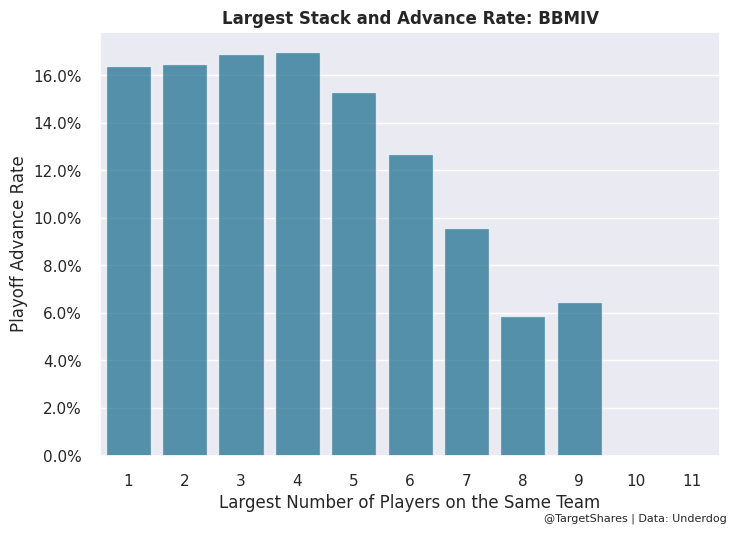
But the next question you might ask is how many players on the same team is enough? The graph below tries to answer that question. The x-axis has the largest number of players on the same NFL team that an entry drafted. The y-axis has the average playoff advance rate for each max stack number. You’ll notice that your odds of making the playoffs increase until about 4 players and then drop off quickly. And that 4th player can absolutely be a running back. In general, teams that included a running back on their team stacks outperformed their peers.


So, stacking helps your team’s odds by requiring you to get fewer things right. However, these benefits only last to a certain point. Eventually, you start cannibalizing your upside. The 4th WR on the same NFL team probably won’t smash alongside the top WRs that you’ve already drafted. You’re no longer drafting as if you’re right. After the 4th player on the same NFL team, you should start focusing on other NFL teams with the assumption that the 4 players you’ve taken will crush their ADPs.
ADP Value
In a perfect world, you would know the ADPs for each player at the end of the tournament and focus on taking players after those closing ADPs. This would maximize your closing line value (CLV). However, I’m not expecting you to be able to predict the future here. And you honestly don’t have to. There are clear benefits to scooping up real-time ADP value in your drafts, regardless of where the ADPs close.
The graph below shows each of the 216 draft picks (12 drafters * 18 rounds) in BBMIII on the x-axis. The y-axis is the median number of points that each pick delivered for the drafter. The blue line is what actually happened. An injury to an early-round player or an early-round player lighting the world on fire are the reasons for the big swings at the start of the blue line. What the green line attempts to do is smooth out those wild fluctuations and create an approximation for how many points you can expect a given pick to deliver for your team.
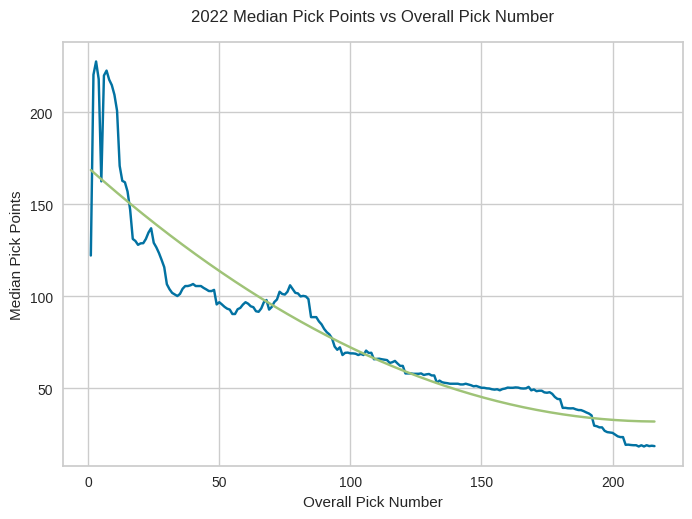
The curved nature of the green line indicates that early round picks are especially valuable, which will surprise absolutely no one reading this. But with that in mind, we can’t treat getting an ADP value at pick 10 the same as at pick 200. That’s the point of the green line; to correctly weigh the ADP value gained by each tournament entry.
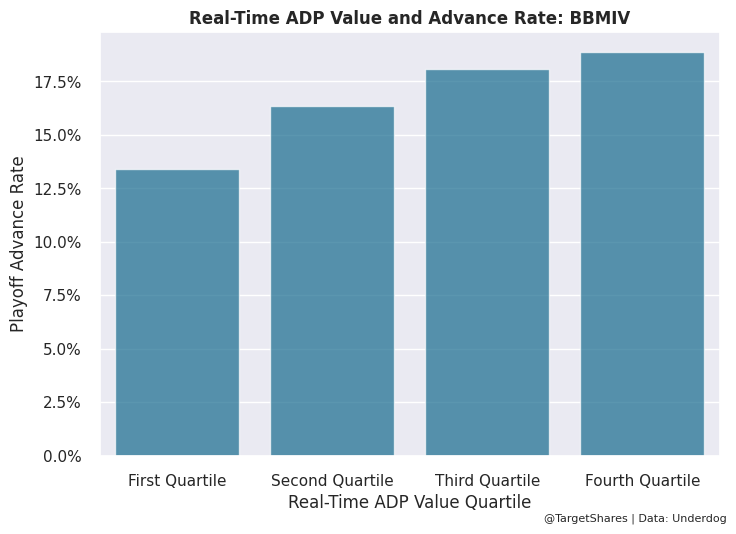
The graph below adds up the real-time ADP value earned by each entry and splits them into four buckets. The first quartile captured the least ADP value, while the fourth quartile captured the most. It’s a very clear trend; the more ADP value you can grab, the better. And this is even more true for teams that made it to Week 17. The average team in the BBMIV finals was deep into the third bucket for ADP value. If you want to make the playoffs and Week 17, a great and controllable thing to do is scoop up as much real-time ADP value as you can.
Player Takes
Now if you knew in advance who the best players will be in 2024, you should just take those players. Unfortunately, that’s incredibly difficult to do. It’s why almost all of this article is focusing on structural components of best ball drafts that you can control. Things that boost your odds of being profitable even if you don’t know which players will crush in 2024.
Love our content? Check out the GoingFor2 Live Podcast Network!
With that said, we can at least try to player select. One of my favorite WR statistics is the Open Score from ESPN Analytics. Like the name implies, it measures how open a WR is on their routes. The graph below filters for the Best Ball Mania max drafters last year that were in the bottom half of WR draft capital. The x-axis is the average Open Score for the WRs they drafted. The Open Scores are from 2022 and weighted by how frequently they drafted each WR. The y-axis is that drafters’ playoff advance rate.
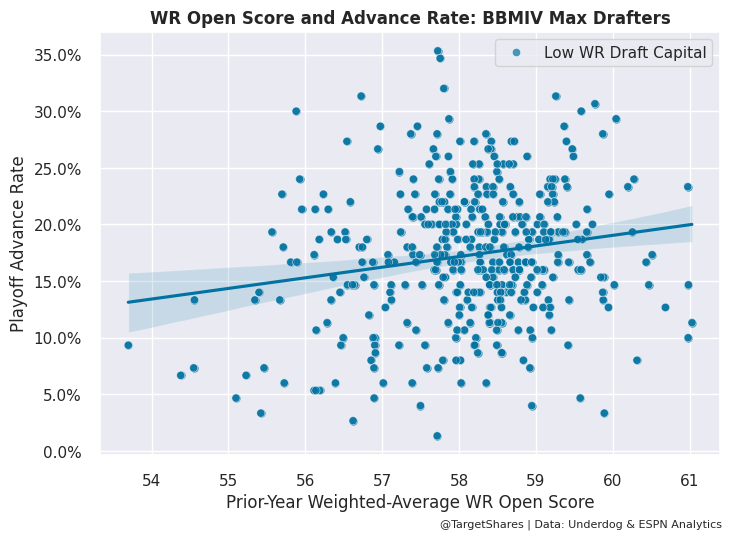
It’s a surprisingly strong connection given that we’re only looking at one variable for one position group. This trend does not hold for the most WR-heavy max drafters, probably because we already knew their highly-drafted WRs were good. But for teams that go RB heavy, this suggests you should focus on WRs with high Open Scores in the previous year. Some targets based on this analysis are: Tyler Lockett, Romeo Doubs, Jakobi Meyers, Jerry Jeudy, Rashid Shaheed, Josh Downs, Dontayvion Wicks, Wan’Dale Robinson, and Rashod Bateman.
For RBs, I’ve found a similar pattern using NFL Next Gen Stats’ Rushing Yards Over Expectation (RYOE) data. The graph below filters for the Best Ball Mania max drafters last year that were in the bottom half of RB draft capital. The x-axis is the average RYOE per attempt for the RBs they drafted. The RYOE numbers are from 2022 and weighted by how frequently they drafted each RB. The y-axis is that drafters’ playoff advance rate.
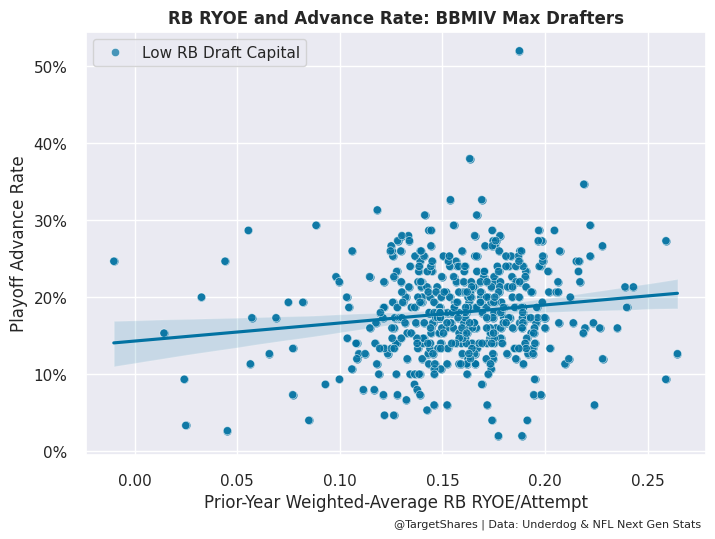
This trend does not hold for the most RB-heavy max drafters, probably because we already knew their highly-drafted RBs were good. What’s also interesting is it doesn’t hold for Next Gen Stats’ version of success rate. So that suggests you should lean into the running backs that are efficient due to big-play potential rather than those that are just successful on a down-by-down basis. Some targets based on this analysis are: Brian Robinson Jr., Gus Edwards, Zach Charbonnet, JK Dobbins, and Khalil Herbert.
Diversification
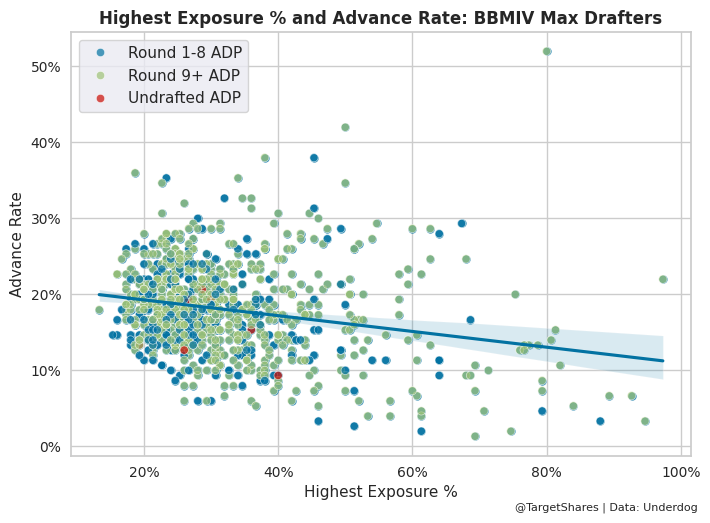
If you’re just drafting one or a very small number of best ball teams, you can skip this section. But for those that plan to fully enjoy best ball summer, I think player (and team) diversification is an underdiscussed element of this game. The graph below focuses how often a BBMIV max drafter selected their top-drafted player. The x-axis is the percentage of drafts where they selected that player. And the y-axis is how often that max drafters’ teams made the playoffs.
It’s a pretty clear trend; as your highest exposure percentage increases, your advance rate tends to decline. But the variance of your outcomes also tends to widen. By that I mean, both the highest and lowest advance rates occurred with higher exposure percentages. So, when you win like Underdog user zabbs did in the top-right with a massive Dak Prescott exposure, you really win. But more often than not, it’s a poor choice.
There is a sweet spot for your top exposure percentage. In 2023, it was between 16% and 24%. The playoff advance rate in that range was about 19.3% or well-above our benchmark of 16.7%. So, if you can manage to keep your top exposure percentage in that range, I think that’s optimal. But I would at least try to keep that percentage below 34%. There’s a strong dip in advance rate above that mark.
Uniqueness
Ok, so you’ve made it all the way to Week 17. Ideally, you’re not showing up with the same exact team as everyone else. That lowers your chances of taking home the big prize. In order to avoid that, you can build some uniqueness into your roster. The graph below looks at the player an entry drafted that ultimately was drafted in the fewest BBMIV drafts. And I bucketed them into quartiles where the first quartile took players that basically no one else took through the fourth quartile where their lowest drafted player was selected 60%+ of the time.
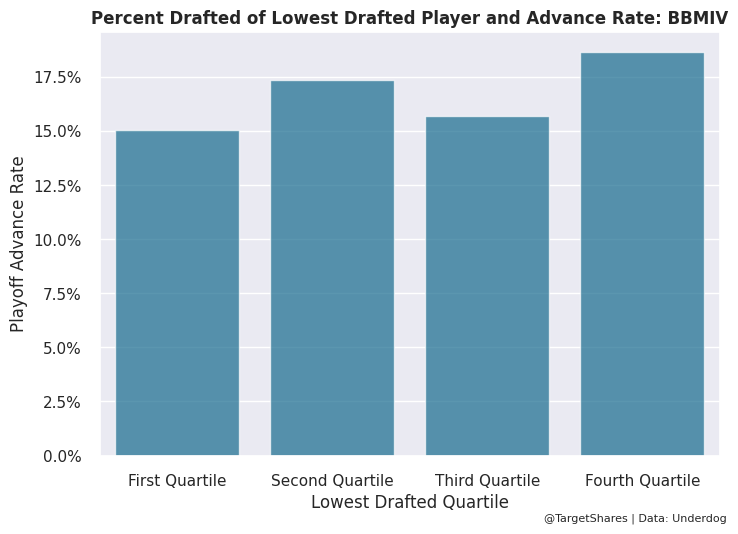
It’s not as clear of a trend as with the other best ball elements we’ve discussed so far. Generally having your lowest drafted player selected more often seems to help your advance rate. But that’s not always true. There is a range where if your lowest drafted player was selected in 17% to 40% of all BBMIV drafts, you still beat the benchmark advance rate. And what’s interesting is the lowest drafted player on BBMIV finals teams was drafted even less often than the typical BBMIV team.
As you start introducing more and more infrequently drafted players to a team, the results quickly drop. But there might be something to targeting one player who won’t be drafted in every best ball mania draft, especially if that drafted percentage is around 30%. That’s hard to do, but there are resources out there like Spike Week that provide best ball ownership projections. One word of caution is this can be highly dependent on one particular player (think Kyren Williams) that absolutely crushes in a given year. I still think it makes sense to be unique, but this bucket in particular is reliant on the players that happen to be in this range.
Week 17
And finally, we have Week 17. And in particular I’m talking about game-stacking. By game-stacking, I mean drafting players on both teams of a given NFL Week 17 matchup. Similar to normal stacking, game-stacking reduces the number of things you need to go in your favor. For example, the Texans and Ravens play each other in Week 17 this year. If you’ve drafted CJ Stroud, Nico Collins, and Mark Andrews, and that game shoots out, then one thing has gone right but you’ve hit on three of your highly drafted players. And you’ve massively increased your odds of winning the entire tournament.
At this point, game-stacking is table stakes among the teams that make the BBM finals. Last year, 90% of finalists had at least one game-stack, defined as having at least 2 players on one NFL team and at least 1 player on their opposing NFL team in Week 17. 64% of finalists had at least 2 game stacks.
One word of caution about game stacks revolves around bye weeks. That same example I gave above is complicated by the fact that the Texans and Ravens both have the same bye week this year. The average advance rate of teams that drafted all of their QBs with the same bye week was only 13.3% last year. That is well below our benchmark of 16.7%. So, if you end up taking both Stroud and Lamar, I’d strongly consider taking a third QB.
Summary
Like I said, it’s a lot to think about. I’ll post the pyramid summary again below and ideally, it’s clearer now after reading this. When I’m on the clock, I’m first making sure that I’m staying within some pretty narrow bounds of roster construction. Something like 2-3 QBs, 5-6 RBs, 7-8 WRs, and 2-3 TEs. I’m taking a look at my previously drafted players and who is available to see if I can stack players on the same NFL team, up to a maximum of 4 players. I’m trying to take players that have slid past their ADP or at least not reaching for players well above their ADP. I’m targeting late-round RBs that showed big play potential last year and late-round WRs that can get open. I’m not hitting the draft button on a player that I’ve taken in more than a third of my drafts even if I really want to. I’m limiting myself to one player that is infrequently drafted (aka a “scroll the eff down” type-player like the Badge Bros reference). And I’m taking players that play against my previously drafted players in Week 17.
I hope you got as much out of this as I did while researching it. As always, you can reach me on Twitter @StephenHoopes with any questions.
ATTN Dynasty Commissioners: Do you want to do something cool for your league? How about a 1-hour live show dedicated to YOUR league? Team-by-team breakdowns, rankings, and more. For details and to book a show, visit: GoingFor2.com/plp.