Predicting the Fantasy Results of the 2023 TE Class
In March, I wrote two articles about applying machine learning models to the 2023 rookie wide receiver and running back classes. Now, let’s turn our attention to the tight-end class. The goal is to project how many fantasy points per game each player will average over their first three seasons in the NFL. From 2015 to 2022, there are 91 tight ends whose speed score we have and whose first NFL season was in this range. This includes both drafted and undrafted players.
These are the players we’ll use to build our model. The benefit of using a machine learning model is that they are uniquely suited to finding complex patterns between variables. Unfortunately, 91 is a very small number of players for a model to learn these patterns on, especially when compared to wide receivers. So, like with any model, we’ll need to provide additional context to its results.
The model uses 14 variables to predict future tight-end fantasy points. The variables can be split into 3 groups: best season production, play style, and general. Best season production includes a player’s top mark across their college career in things like targets per route run, yards per game, and touchdown rate, among others. Playstyle includes things like how often they line up in the slot and their yards after contact per reception. The general group includes where they were selected in the draft and their speed score. I’m currently using NFL Mock Draft Database’s consensus big board for the 2023 class.
What we’ll see later is that the model’s gain from a player’s draft pick is significantly smaller for tight ends compared to wide receivers. The linear correlation between draft pick and fantasy points per game is nearly identical for the two positions. However, the six largest wide receiver hits were all drafted within the first 50 picks of the NFL Draft. Alternatively, two of the three largest tight end hits were drafted well after pick 50. Given that only the elite tight ends move the needle in fantasy football, the model is attempting to find the next George Kittle or Mark Andrews.
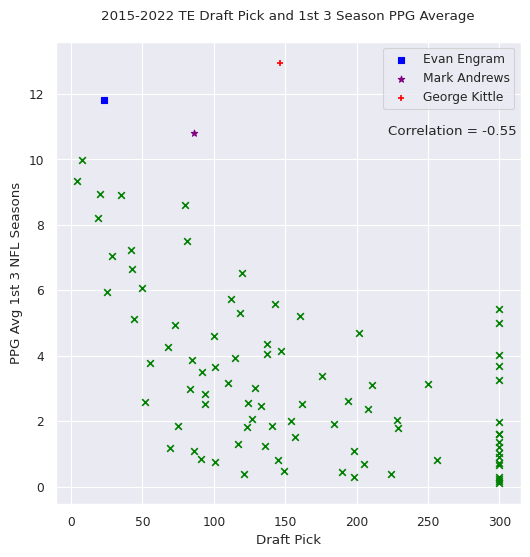
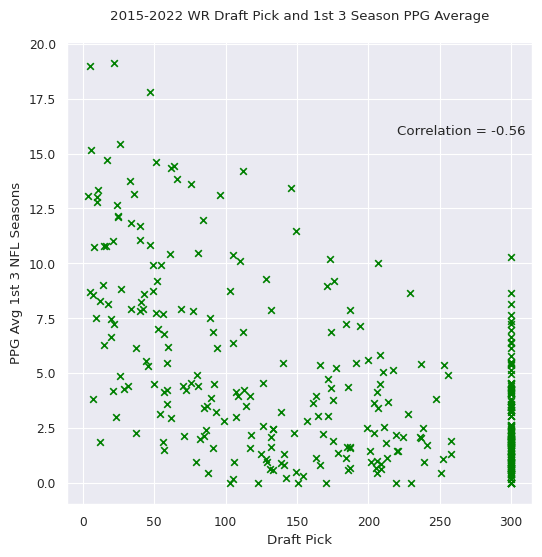
For the TE model, we’re also including speed score, something we excluded for WRs. For WRs, Combine statistics are much more predictive of their draft selection than their actual NFL value. Alternatively, athleticism for tight ends is a meaningfully predictive variable and so it’s included here. There is a major downside to including speed score, though. We can’t keep players that weren’t invited to the combine or didn’t take part in the 40-yard dash in our dataset. As a result, those players are not helping predict future TE fantasy points per game.
So what variables matter for future NFL fantasy points? Below is a bar chart that shows the model’s gain or relative contribution to the model by variable. A higher number indicates that a variable is more important for prediction. Each position has a very different split, as mentioned with the relative importance of draft capital differing for wide receivers and tight ends.
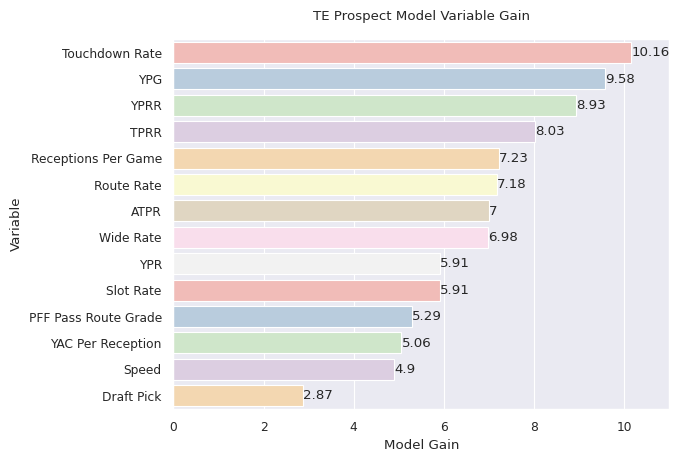
The four variables at the top that provide the model with the largest gain are all best-season production metrics. Yards per route run being so high isn’t a surprise, given how predictive it is for wide receiver prospects. Speed score falls at the end of the third tier of model variables, while draft capital provides the least gain. As mentioned, this is due to the likes of George Kittle and Mark Andrews. It will be interesting to see how the model adjusts if Kyle Pitts puts up a large number of fantasy points in his sophomore and junior seasons.
So, let’s see how the model actually performs. I held last year’s class out of the model-building process to get a sense of how good it is at projecting future fantasy points.
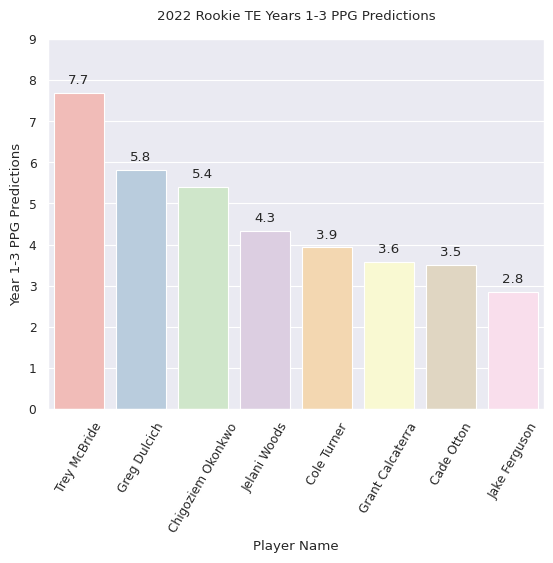
The 2022 class has only had 1 NFL season, but we already have an updated sense of how they’ll perform. Trey McBride honestly hasn’t done much in the NFL yet. He had to compete with Zach Ertz for targets in year 1 and only grabbed about a third of TE receptions on the Cardinals. And given Ertz’s dead cap number in 2023, it seems like McBride will have to wait until at least 2024 to take over the TE position on his team.
I’m particularly pleased with Dulcich and Okonkwo landing with the second and third-highest projections. I recently wrote an article about Okonkwo finishing the 2022 season within the top 5 of WRs and TE in yards per route run. I’m relatively bullish on his chances to succeed next season. Now let’s take a look at 2023.
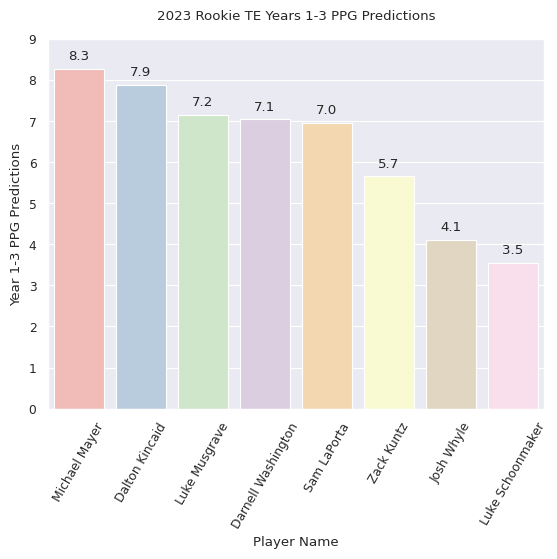
No real surprises at the top with Michael Mayer and Dalton Kincaid leading the way for the 2023 class. There has been a lot of discussion around the talent of this tight-end class and it’s easy to see when comparing the 2023 bar chart to the 2022 chart. We have five players with 7+ average point projections in their first three seasons compared to only one in last year’s class.
Given differences in their projected draft capital among the second-tier rookie tight ends, the model really likes Sam LaPorta. LaPorta had the third-fastest 40-yard dash among tight ends at the combine. He also has an impressive production profile, with the third-highest best-season targets per route run mark. Moreover, he has a larger sample of games to draw from, playing about a dozen more college games compared to Kincaid, Musgrave, and Washington. Generally, though, it’s a very strong tight-end class with some top-end talent and five potential difference-makers at the position.
Love our content? Check out the GoingFor2 Live Podcast Network!
ATTN Dynasty Commissioners: Do you want to do something cool for your league? How about a 1-hour live show dedicated to YOUR league? Team-by-team breakdowns, rankings, and more. For details and to book a show, visit: GoingFor2.com/plp.


