Introducing The Middle Bucket: Slot Rate’s Correlation To Fantasy Points
I create machine learning models each year that predict how many fantasy points incoming rookies will score in their first three NFL seasons. The benefit of using machine learning models is that they are uniquely suited to finding complex patterns between variables.
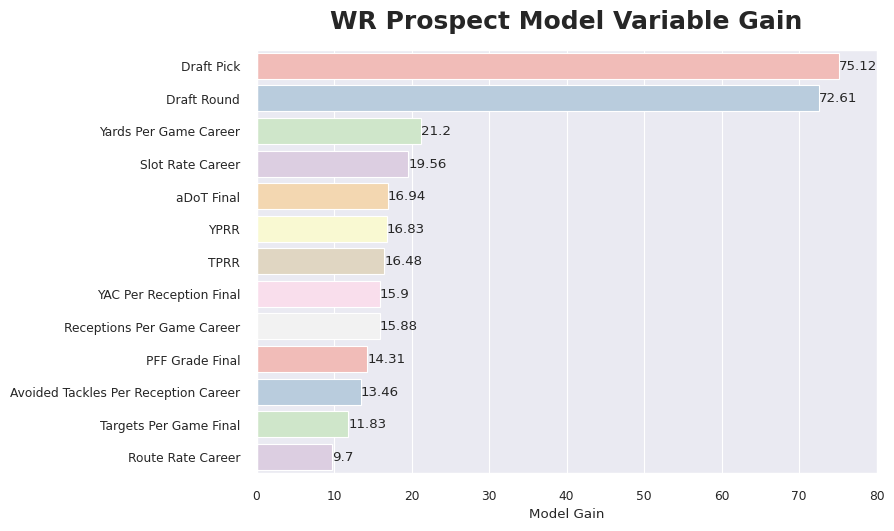
So what variables matter for predicting future NFL fantasy points? The below bar chart shows the model’s gain (or relative contribution to the model) by variable. A higher number indicates that a variable is more important for prediction. Each position has a very different split, with a player’s selection in the NFL draft being relatively more important for WRs than any other offensive skill position.

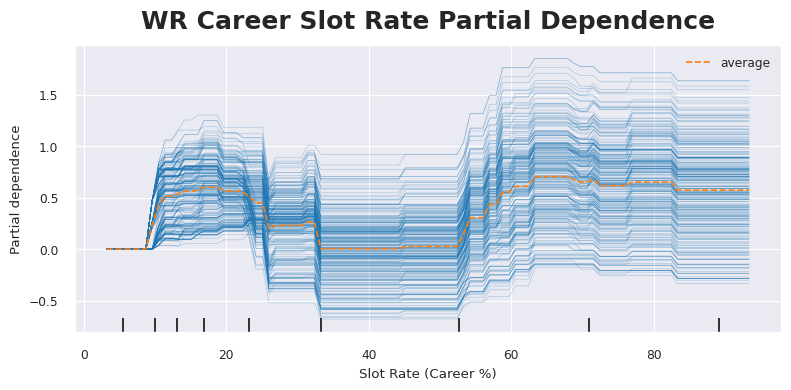
So, when a player is selected in the draft is extremely important in predicting their future NFL fantasy points. That’s not surprising. What is surprising is how much gain is derived from a player’s career slot rate. The below graph shows the model’s career slot rate partial dependence plot. Machine learning models are often described as black boxes, meaning it’s difficult to determine how the models work. Partial dependence plots are a great way to shine some light on their inner workings. They show how each variable affects the model’s predictions while averaging out the effects of the other variables (like draft capital in this instance).

So, what are we seeing with career slot rate? It’s easiest to focus on the orange line, which averages out the impact of slot rate among all of the players in our dataset. When the orange line is above a partial dependence of 0, it means at that career college slot rate, players typically score more fantasy points in the NFL.
What’s strange is the distribution is bi-modal, or just a fancy word for having two peaks. The dip in the middle is what caught my eye. It looks like historically, players with a career slot rate between 33% and 53% tend to struggle relative to their peers. I have a couple of guesses as to why this is the case, but no definitive answer. I had always assumed that a player’s versatility would be viewed as a positive. But perhaps the most talented players can carve out a defined role in their college offenses? If you have a guess, I’m @TargetShares on Twitter and would love to hear from you.
But take a look at the below table. It shows the average fantasy points per game for WRs in their first three NFL seasons. And it splits them by career average college slot rate. The “middle bucket” is that drop in the partial dependence plot we saw earlier. You can see that the low and high slot rate groups average about 5.0 PPR points per game. The middle bucket is significantly lower at 4.3. And the average draft spot is about the same for all buckets.

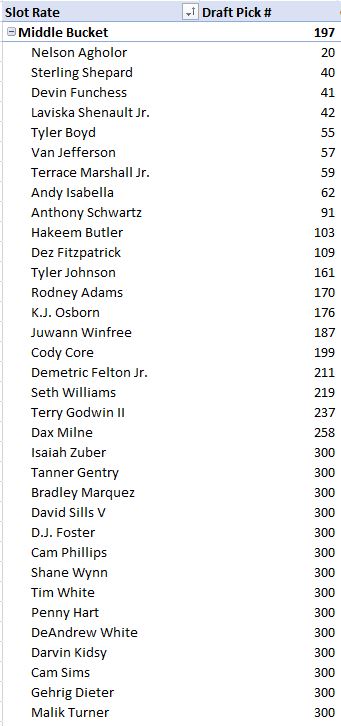
Now, the sample size we’re working with is small. Of the 374 qualifying WRs we have since 2015, only 40 fall in the middle bucket. But here is the complete list of NFL WRs that have had the opportunity for 3 NFL seasons (i.e. drafted in 2021 or earlier) that landed in the middle bucket.

Woof. Ok so who falls in the middle bucket this season? Only two players in the 2024 class have the unfortunate distinction of being in the middle bucket for career slot rate: Ladd McConkey and Tahj Washington. Now I don’t think this is a death knell for either player. The whole point of modeling is to look at the complex relationships between variables and not focus on one individual stat. Ladd in particular has one of the wildest production profiles I’ve ever seen and Brian Ford does a fantastic job walking us through it here. But if you’re looking for a reason to fade Ladd, just look at that above list of names again.
ATTN Dynasty Commissioners: Do you want to do something cool for your league? How about a 1-hour live show dedicated to YOUR league? Team-by-team breakdowns, rankings, and more. For details and to book a show, visit: GoingFor2.com/plp.


