Building on the analysis done for receivers, let’s now dig into quarterback talent and style. I’ll be using the different components of expected points added (EPA) for this purpose. EPA is the difference in the number of points a team is expected to score at the end of a play compared to the beginning of a play. A positive play increases EPA, while a negative one decreases it. Expected points consider the context of the situation, including the down, distance, and current score.
Nfelo provides components that make up EPA for each QB and how they perform relative to the rest of the league. The seven components are: rushing, sacks, incompletions, interceptions, air yards, yards after the catch (YAC), and penalties. For example, Patrick Mahomes has a positive value in the sack component vs. the rest of the league. He loses fewer EPA to sacks than the average QB. It is these components that I’ll use to cluster QBs into groups based on their performance and style.
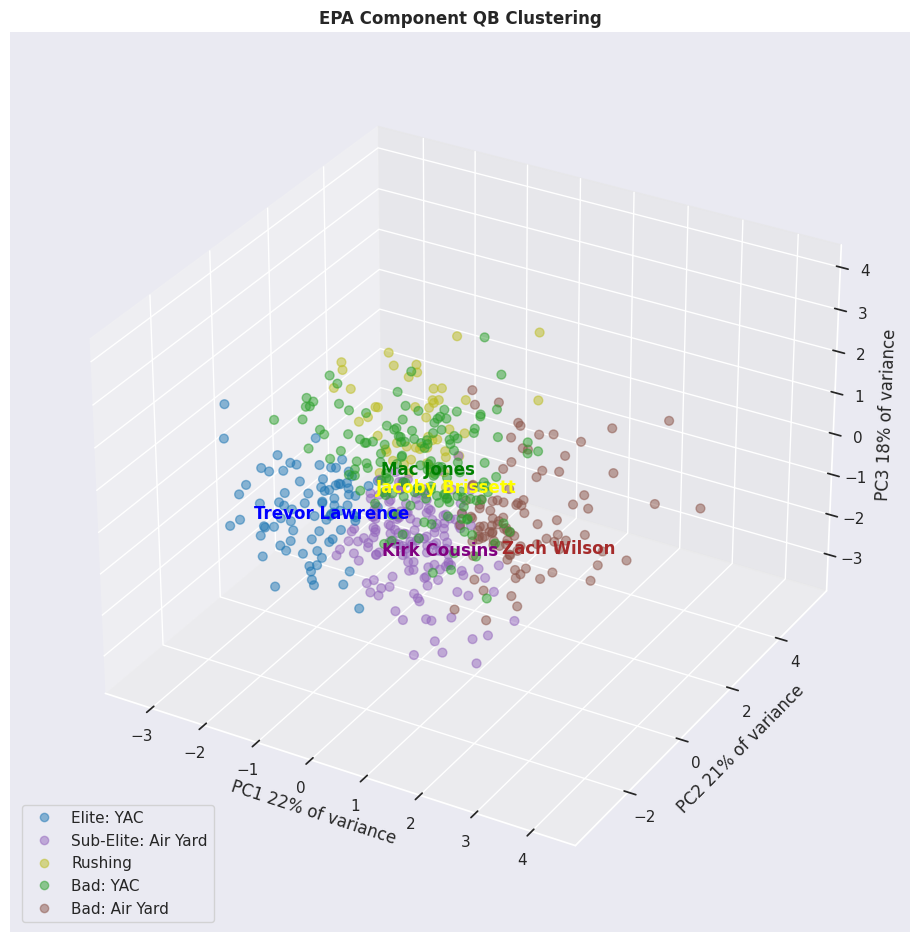
To visualize the clusters, I needed to reduce the number of variables from seven down to three. I used principal component analysis (PCA) for this task. PCA reduces the number of dimensions/variables in your data while preserving as much information as possible. I clustered on the three principal components that account for the majority of the variance derived from the seven EPA components. This analysis includes every individual QB season with at least eight starting games since 2006. The five resulting clusters can be best described as:
- Elite QB seasons with YAC as their best component
- Sub-elite QB seasons with air yards as their best component
- Rushing QBs
- Bad QB seasons with YAC as their best component
- Bad QB seasons with air yards as their best component
For each of these clusters, I’ve also provided a very colorful graph. What the graphs show is the cumulative average EPA per dropback for each QBs’ career. After each dropback, a quarterback’s average EPA changes slightly. The graphs show the range of this value for each QB and how consistent that value has been. A very skinny and tall curve means that a quarterback’s career EPA has been very stable. Alternatively, a wide and short curve indicates that a quarterback’s EPA has changed a lot during their career. The cluster where a QB is assigned is solely based on their 2022 season, so their career distributions can provide some additional information.

Elite: YAC Cluster
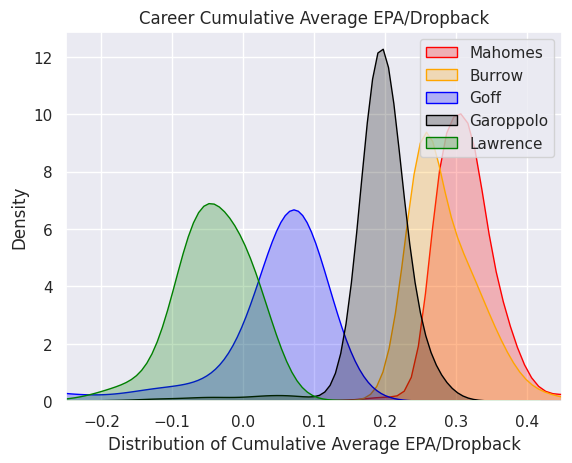
This is the tier you’d like your QB to fall in if they aren’t particularly mobile. This cluster averages an elite 0.21 EPA per dropback. The players in this tier tend to excel relative to their peers in EPA from YAC. They also tend to limit interceptions and sacks, with the latter being a particularly important and under-discussed element of Mahomes’ brilliance. Trevor Lawrence’s 2022 season is the prototypical illustration of this cluster. You can see on the graph above that his career EPA is lower than the rest of his cohort. However, he took a giant leap in 2022. While still above average in EPA from sacks in 2021, he was below average in every other component, finishing with -0.06 EPA per dropback and landing in the same cluster as Baker Mayfield and Zach Wilson. There is clear optimism that Lawrence’s distribution can continue to move sharply to the right in upcoming seasons.
Sub-Elite: Air Yards Cluster
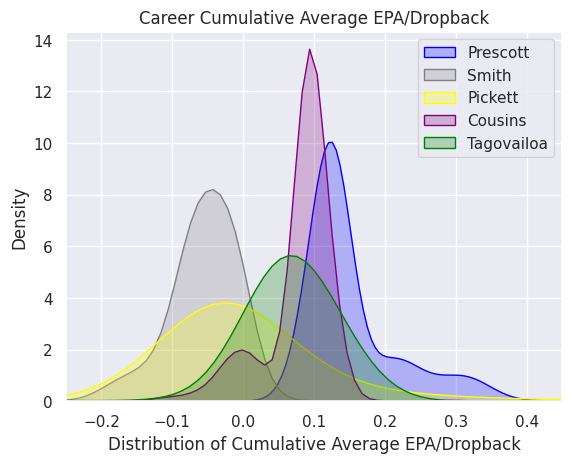
This is the second-best tier for non-mobile QBs. This cluster averages 0.11 EPA per dropback, which is about half of the previous cluster. Kirk Cousins’ 2022 season is the best illustration of seasons that land in this tier. Cousins has actually been in this cluster for three consecutive seasons and you can see how consistent his EPA has been in the graph above. QBs in this tier tend to excel relative to their peers in EPA from air yards (thank you, Justin Jefferson), but are league average in the other EPA components. Tua’s 2022 season was actually the most extreme example of this dynamic since at least 2006. He gained 0.24 points more per dropback from air yards EPA compared to the league average QB.
Rushing QBs
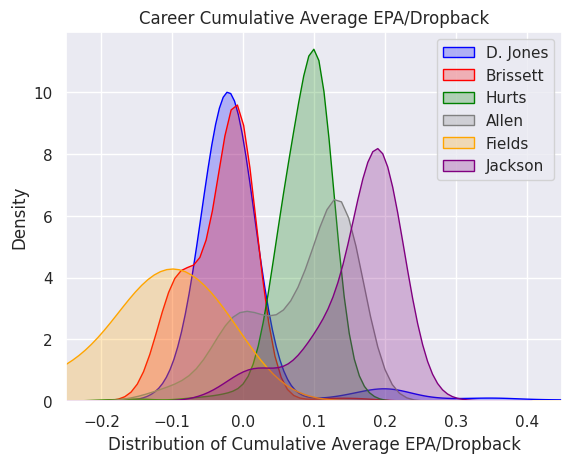
Here we have our mobile QBs. The average EPA per dropback in this tier is 0.12, which is about the same as the previous cluster. The big difference is that this cluster is above the league average at EPA from rushing. Players in this cluster also tend to limit incompletions and interceptions, and perform about as well as the previous cluster in EPA from air yards. Jacoby Brissett’s 2022 season is a good representation of the cluster as a whole, which is interesting because I don’t tend to categorize him as a rushing QB. Regardless, I know the hype around Sam Howell is high at the moment, but I hope that Brissett gets a shot at the starting QB job in Washington after his very strong 2022 campaign. The other members of this cluster are the names you’d expect to see like Lamar Jackson, Justin Fields, and Jalen Hurts.


Bad: YAC Cluster
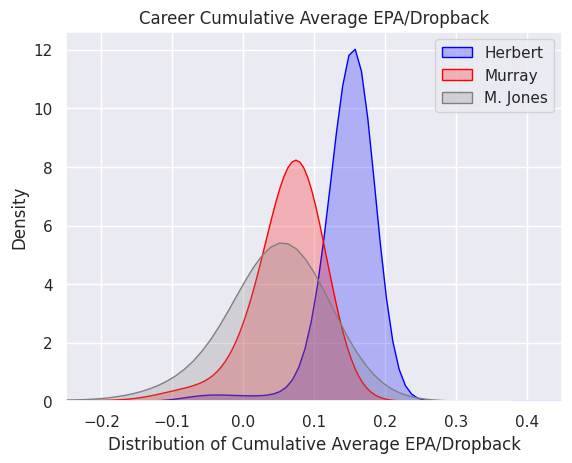
A lot of QBs land in this cluster so I’ve highlighted only a few of them in the graph. This tier is similar to the first cluster but with a substantially lower EPA per dropback. Players here tend to have an above average EPA from YAC but are either average or below average in the remaining six components. Mac Jones’ 2022 season was representative of both the cluster as a whole and the players I’ve chosen to highlight. It was a down year for Jones, Murray, and Herbert. Herbert has the easiest case for a strong bounce back in 2023. He has a longer history of a strong EPA per dropback, improved receivers, and a new offensive system that should highlight his ability to drive the ball down the field. Other, non-highlighted members of this cluster include Baker Mayfield, Matthew Stafford, and Ryan Tannehill.
Bad: Air Yards Cluster
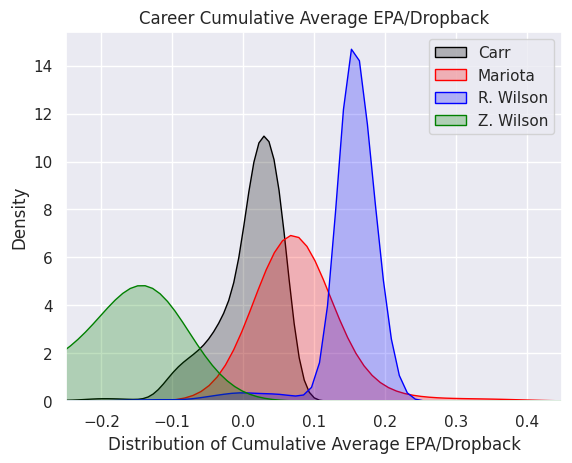
This tier is similar to the second cluster but with a substantially lower EPA per dropback. Players in this cluster tend to perform above the league average in EPA from air yards but average or below average in the remaining six components. Derek Carr had the best EPA per dropback of a QB in this cluster. Despite landing here, his 2022 season was 0.05 EPA per dropback better than Andy Dalton (hello, Chris Olave). Zach Wilson’s 2022 season was more typical of the average season in this cluster, though his EPA per dropback was weaker than for the tier as a whole. Given that this is his second consecutive season in this cluster, there’s not a lot of reason for optimism (not that there is a ton out there).
Conclusion
While there is strong correlation in the clusters year-over-year, there are plenty of examples of QBs making sharp improvements or declines. For every Mahomes, who has been in the elite cluster in each of his five starting seasons, there is a Derek Carr that has oscillated between the bad and sub-elite buckets. We’ve also seen the sharp improvements of Josh Allen and Justin Fields, both of whom started in the “Bad: Air Yards” cluster before seeing their EPA per dropback improve significantly.
It’s why I like this view; it allows us to see the distributions of success these QBs have had, rather than over-indexing on the previous season. Russell Wilson has had two seasons land in the bad clusters, with nine seasons in the positive clusters. He’s been a model of consistent and strong EPA per dropback values since entering the league. It lets us feel more confident in betting on a bounceback season in 2023. Taking a larger scope and viewing potential outcomes as probabilities, rather than being locked in on one view of the situation, can allow you to see opportunities that your league mates will not.
Love our content? Check out the GoingFor2 Live Podcast Network!
ATTN Dynasty Commissioners: Do you want to do something cool for your league? How about a 1-hour live show dedicated to YOUR league? Team-by-team breakdowns, rankings, and more. For details and to book a show, visit: GoingFor2.com/plp.